ANALYZE SURVEY RESULTS
Draw conclusions from the survey easily, segment responses, and analyze trends
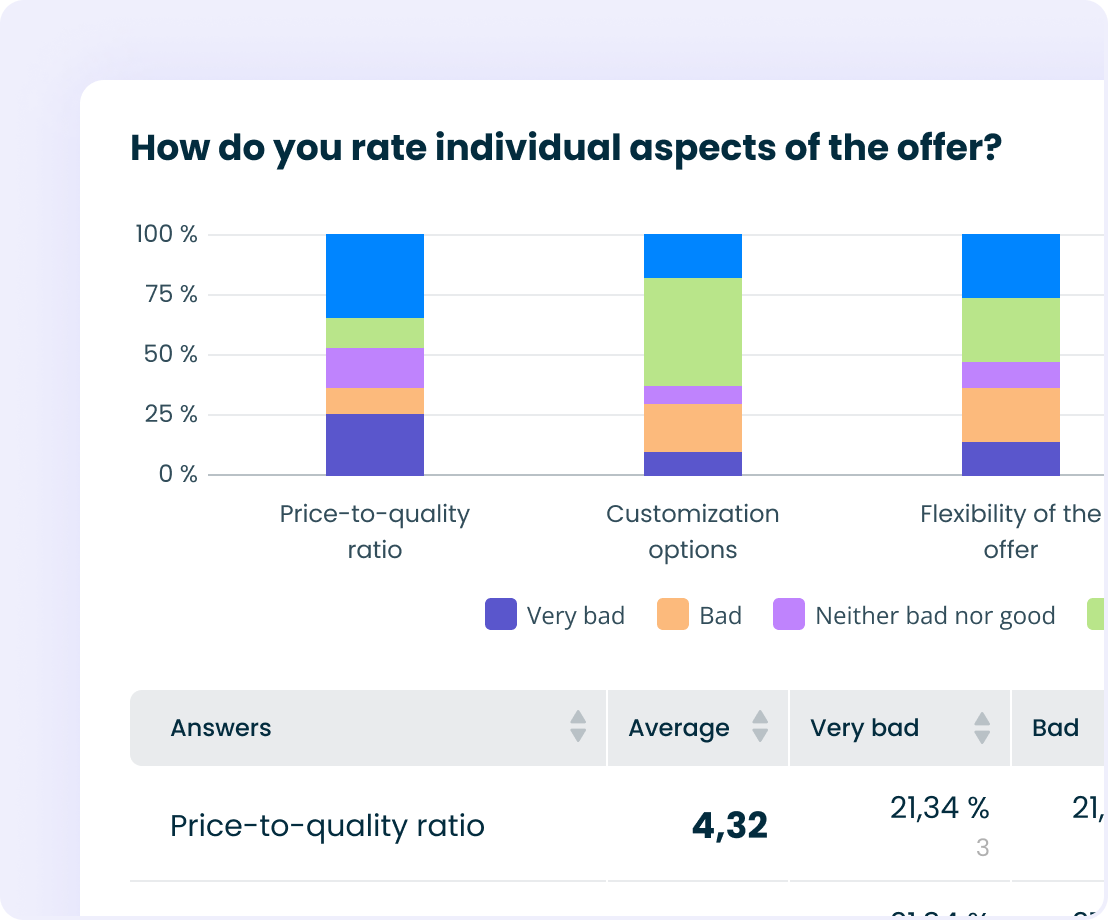
Graphs and tables with answers
Include a customer or order ID in the survey link and easily associate responses for a broader context. React individually to a comment from a dissatisfied customer.
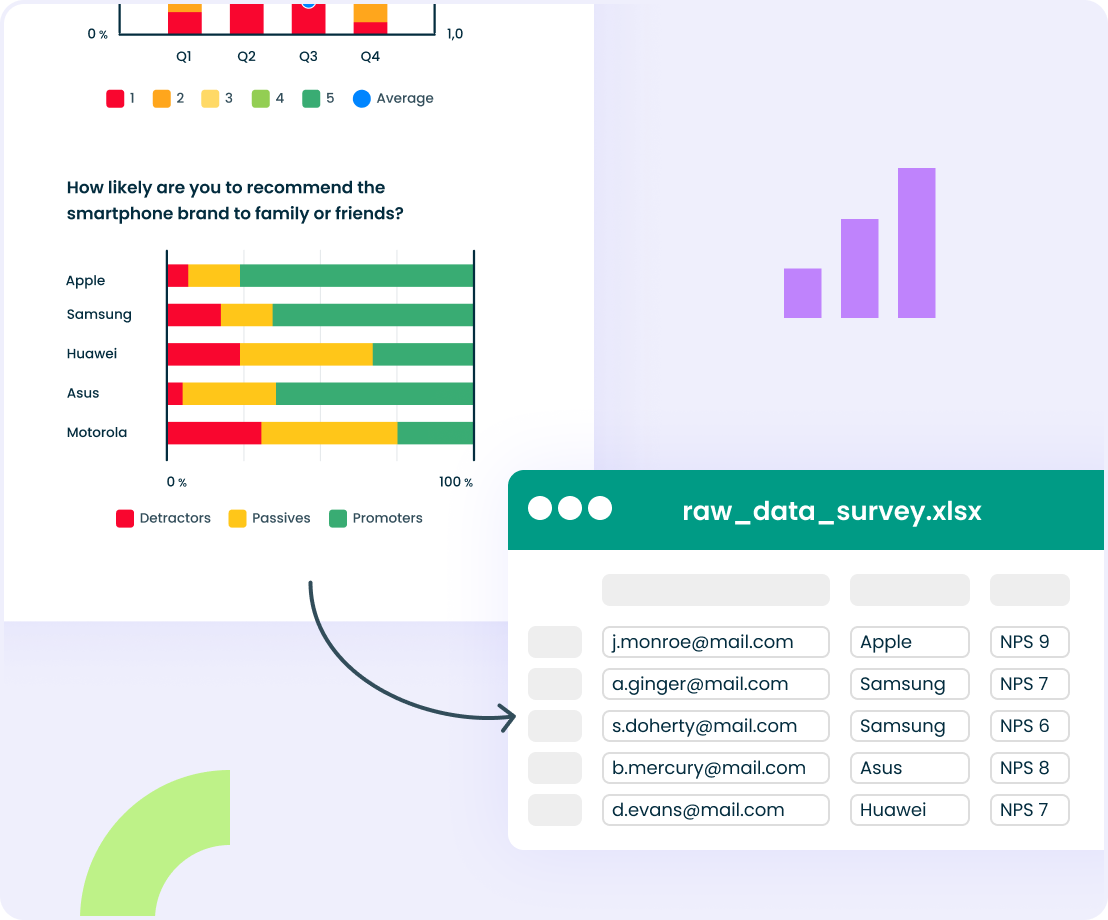
Export of results
Download raw data for further analysis in csv or xls formats. You can download raw data in the Responses tab.
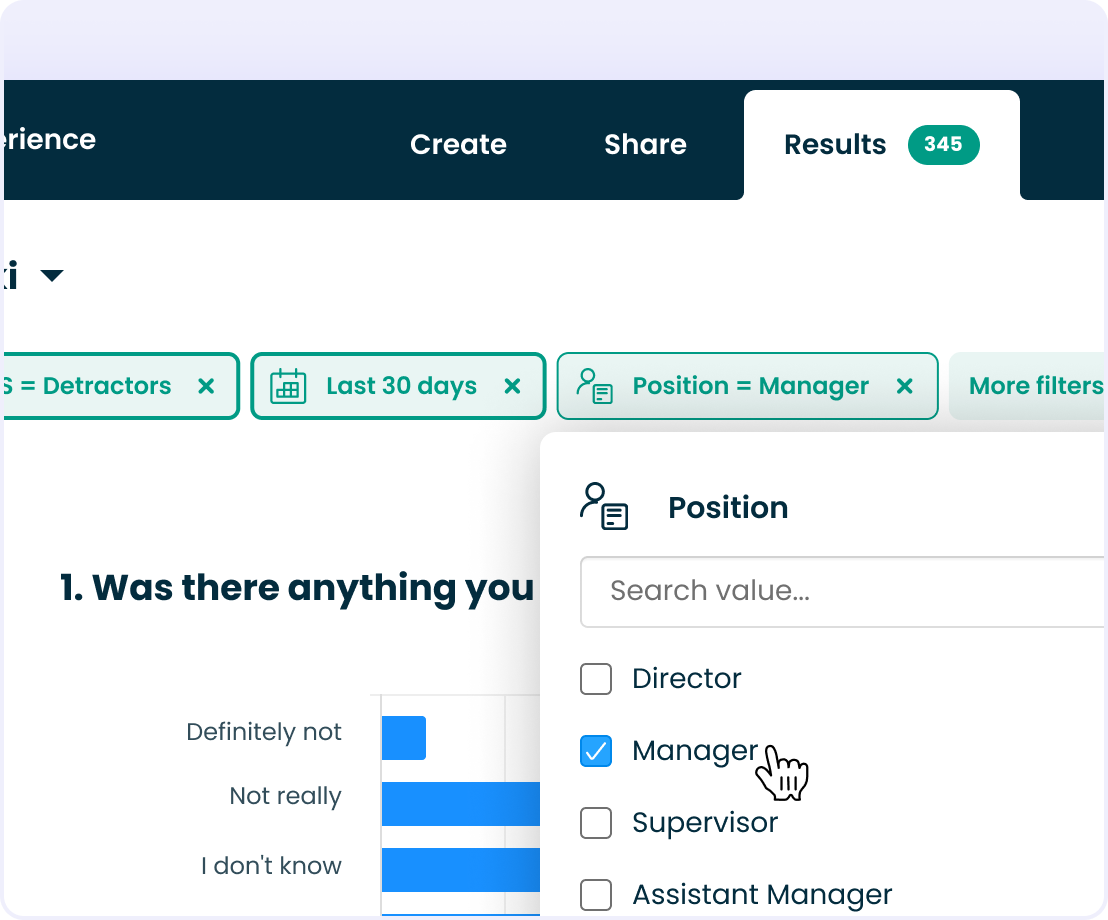
Advanced filtering
Segment responses, create data filters, and search for dependencies and trends in subgroups of collected data — filter by time, respondent’s data, and responses.
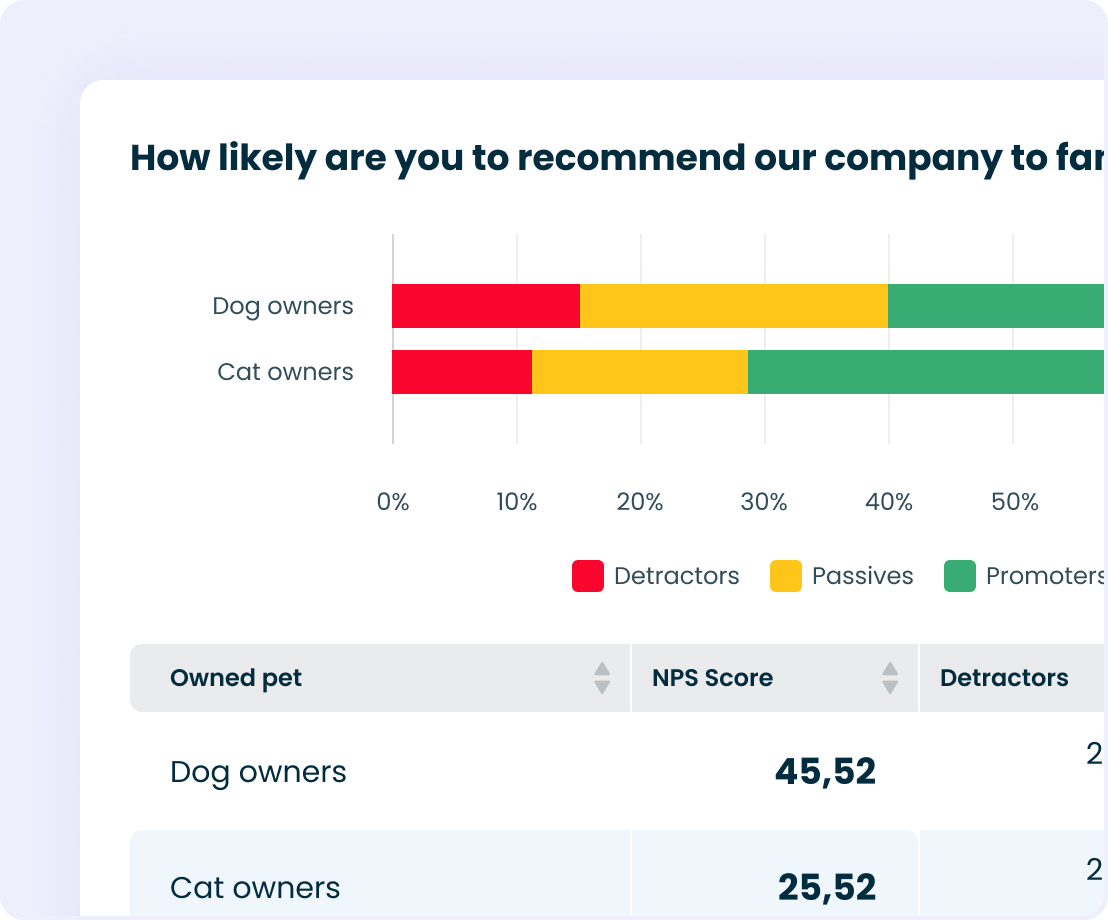
Cross Tables
Create comparative analyses, and check how the groups of respondents responded and the relationships between the answers.
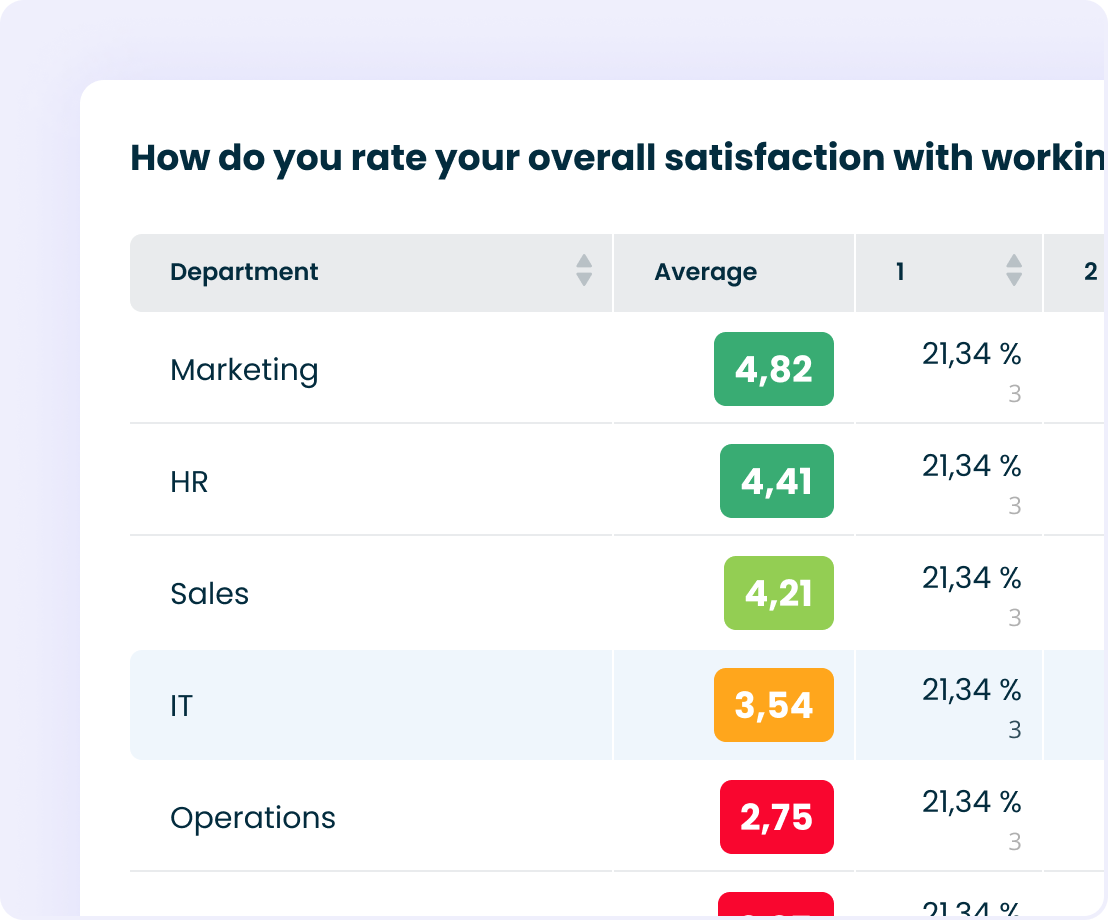
Rankings
Create rankings of the best, most popular, highest and lowest rated answers.
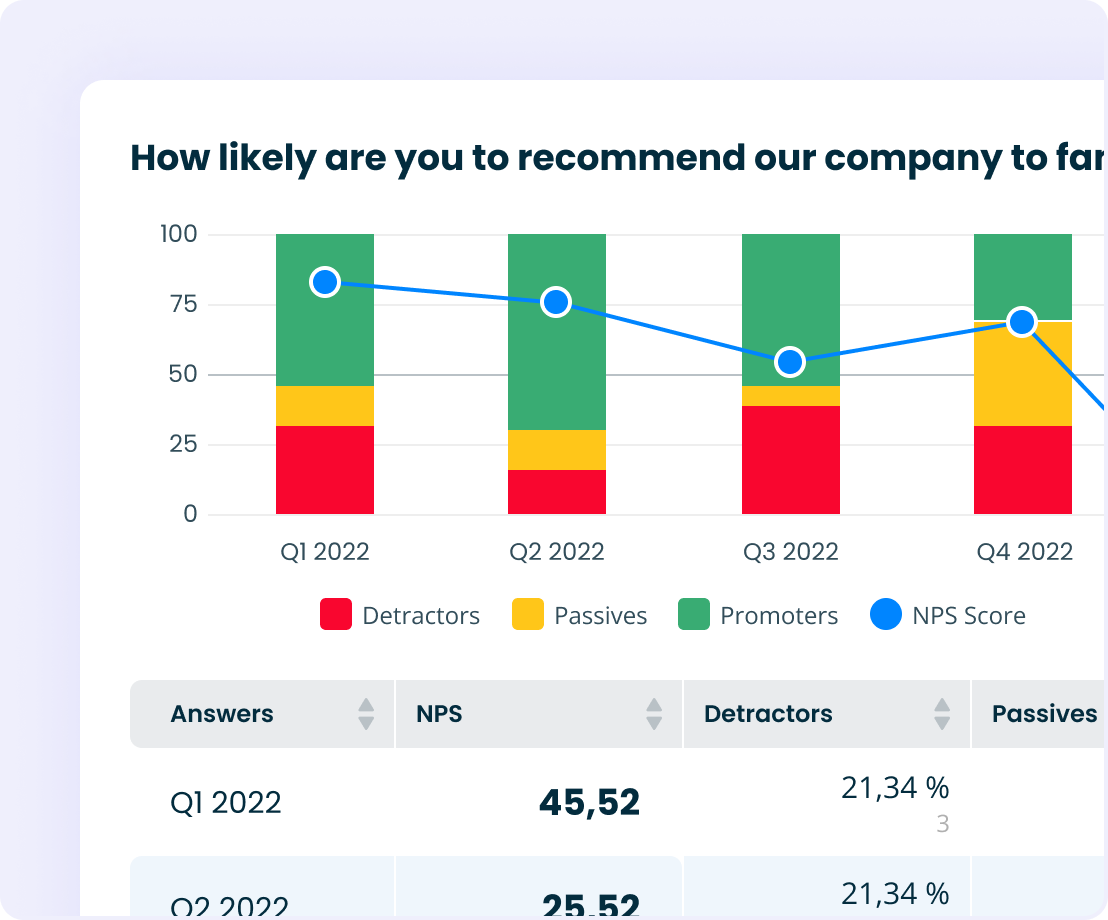
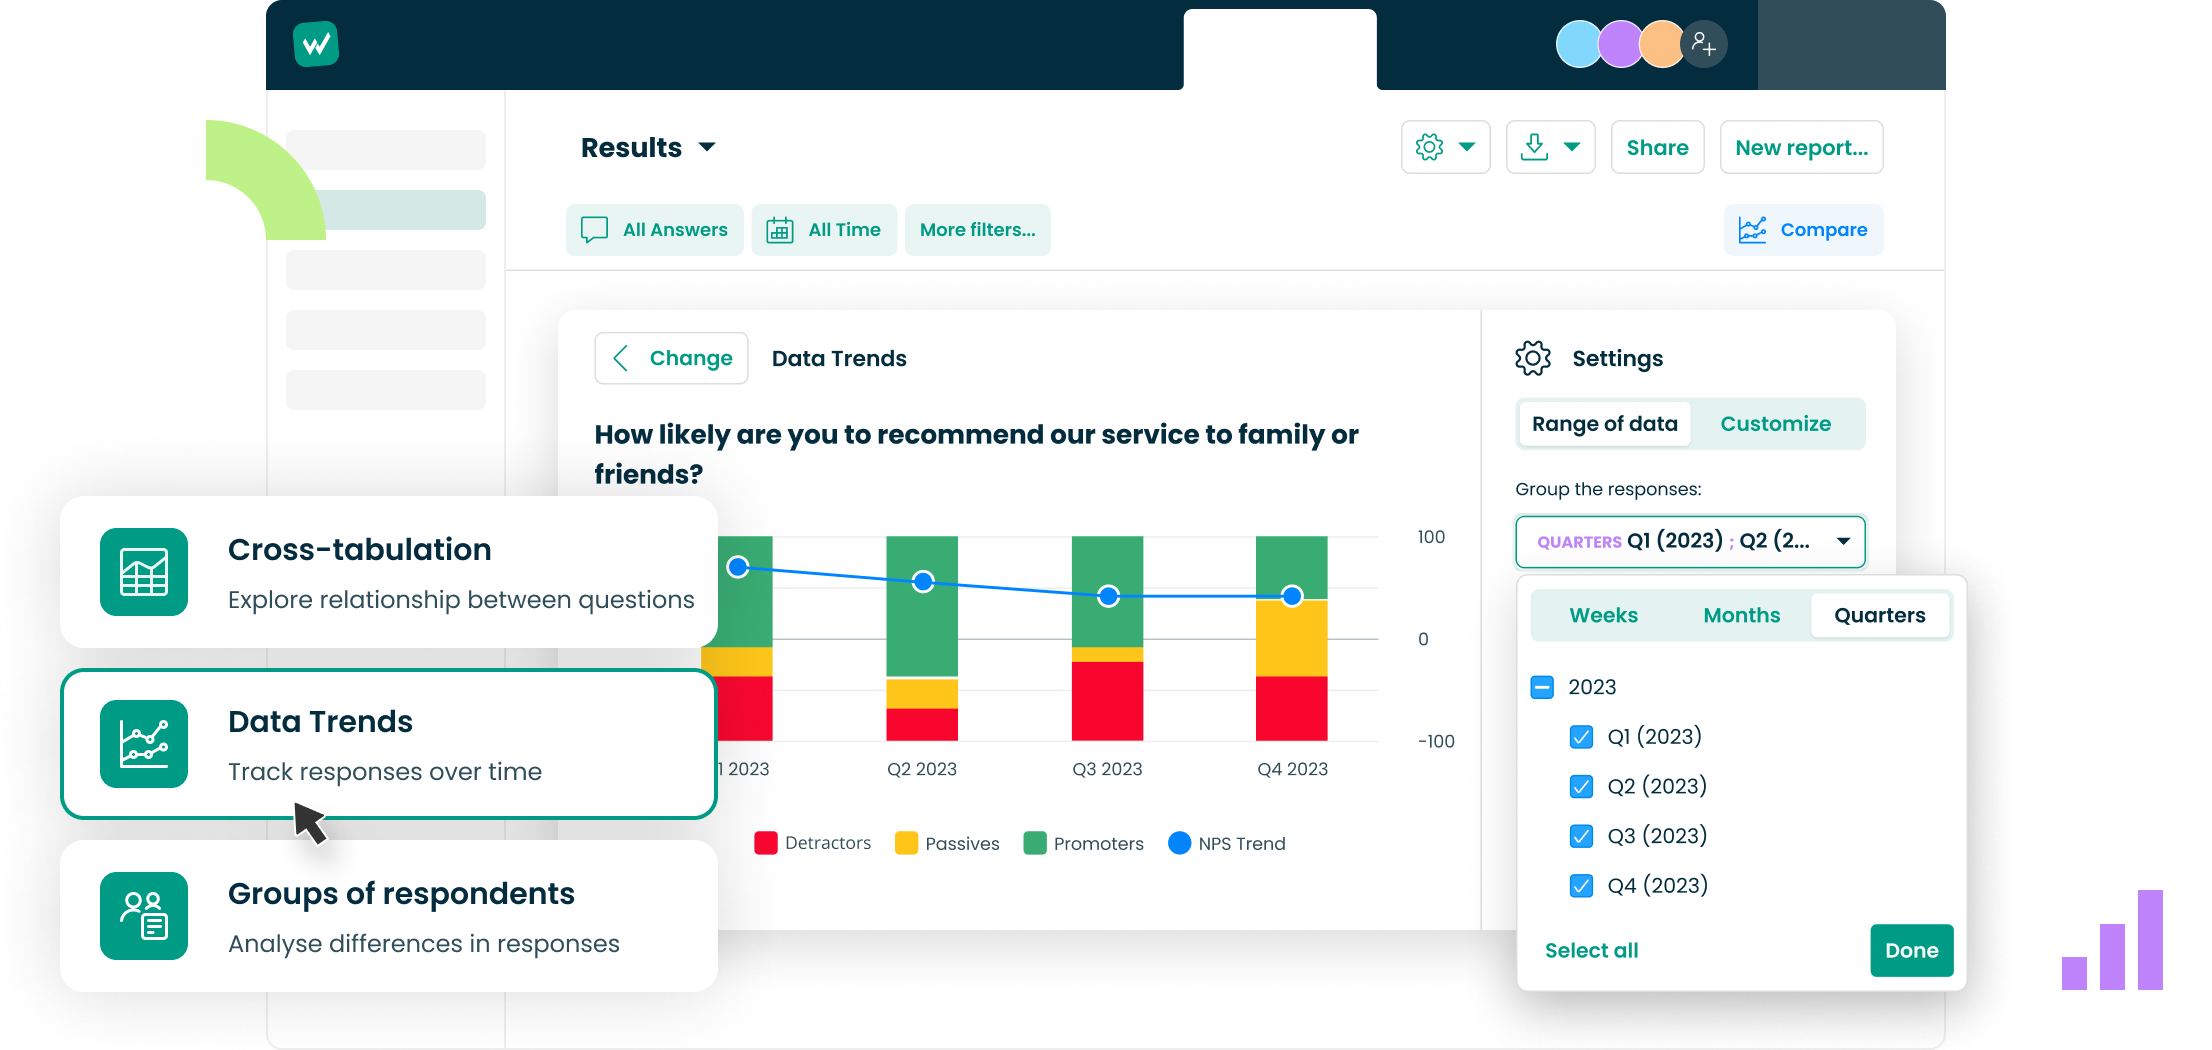
Trends
Keep your finger on the pulse and track your business metrics over time (weekly, monthly, quarterly). Understand the reasons behind sudden drops or forecast customer behavior in the future.
Trends are also available in Beta Results. You can add them anywhere in your report by clicking on the ‘plus’ icon before or after the question (for single and multiple-choice questions, NPS, Ratings, and single-choice matrix).
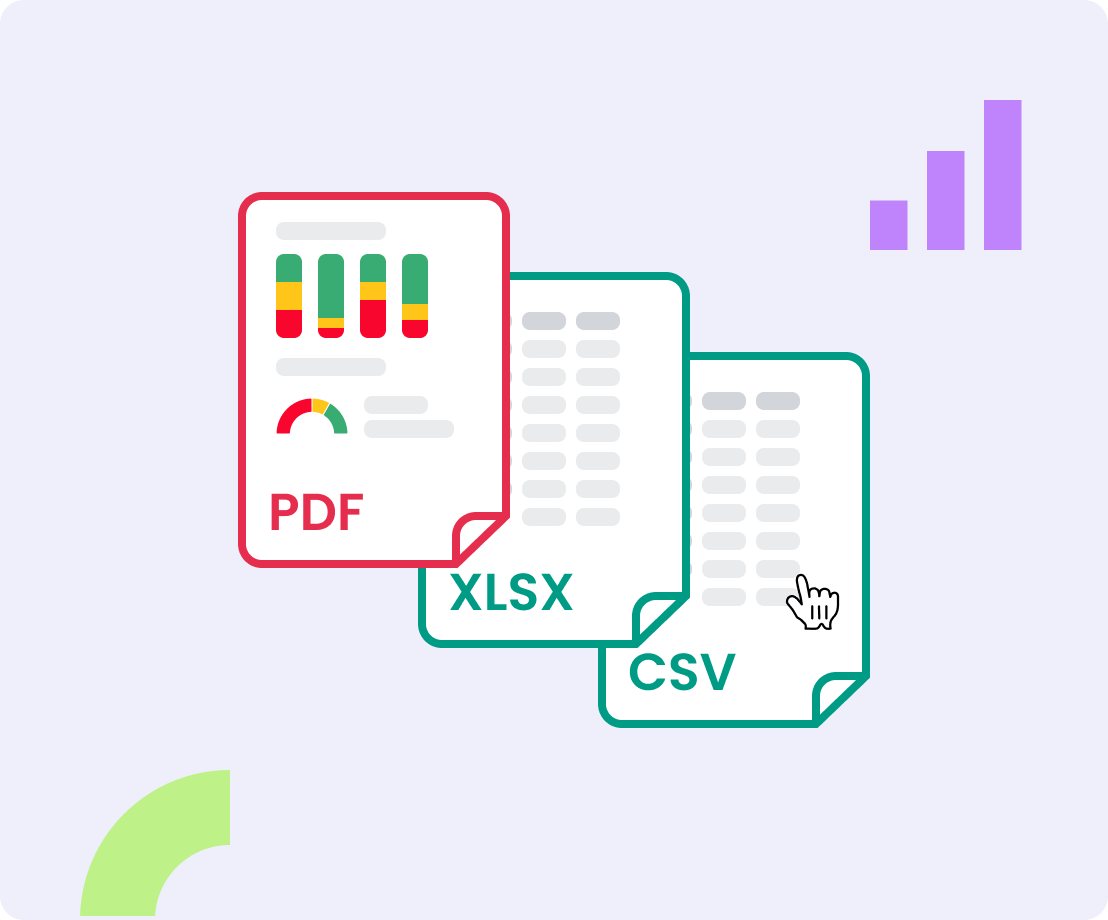
One-click reports
Export reports to PDF or raw data in Responses with one click.
Grouping of similar answers
Group similar answers given into thematic areas and create segments of respondents based on them.
Linking to respondent attributes
Provide additional information about respondents to the survey link and use this data for collective analysis of the results.
Collaboration within the team
Share the results with colleagues to work together on the collected data.
Single completions overview
Check how particular respondents answered.
Explore all the features
-
Surveys in multiple languages

-
Overview

-
Question types

-
Branding & White Label

-
Logic, Branching & Piping

-
Tests & Quizzes

-
Sharing & Collaboration

-
Forms

-
Survey Distribution

-
E-mail Surveys

-
Website Surveys

-
Workflows & Automations

-
Respondents Identification

-
Analyze Results

-
Reports

-
API & Integrations

-
Tagging Responses

-
Data Security
