If we compare any survey to cinema, presenting the survey results is like the main character’s monologue in the climactic scene. The success of the entire production often depends on the credibility and clarity of the message. In this article, we will show you how to present the collected feedback to a group of recipients effectively. We will also see that research reports have something of both Barbie and Oppenheimer.
Speaking of movies. Remember the final scene of Schindler’s List? Holocaust survivors and actors starring in Steven Spielberg’s production visit the grave of Oskar Schindler and – according to Jewish custom – place stones on it. It is a sign of respect and a symbolic thank you to the man who saved over a thousand people from certain death.
The characters in this silent scene don’t need words to move us.
This scene perfectly illustrates the golden rule of cinematography. Show, don’t tell. A good photo says more than a thousand words, right? This rule works not only in the hands of cinema masters. Literature, marketing texts, television, and multimedia advertisements – creative artists and marketers take full advantage of it because each of them knows that they only have a moment to gain the recipient’s attention.
Anyone who has ever presented survey results to a management board knows exactly what I’m talking about.
The Golden Trio of Survey Research
Not only art has its laws. Also, such prosaic activity as online CX, HR, or market research surveys have their golden rules.
– Each complete survey consists of three elements – says Paweł Kruszewski, Account Manager of the Startquestion platform. – It involves creating a survey, collecting the results, and presenting them in an understandable form to specific recipients.
While the stages of survey research do not differ, regardless of whether they concern customer experiences, employee relations, or market expectations, how their results are presented depends on who conducts the research and draws conclusions.
What Is a Survey Report?
TL;DR
Any effective form of sharing survey results.
Let’s reach for a broader definition:
A report is a (usually) selected set of the most necessary data collected during the study. They can be presented using charts, tables, trends, filters, or rankings or described in words.
Regardless of its form, the report’s purpose is to give data reliably in a way that is understandable to the recipients.
When Should You Prepare a Research Report?
As we already know, reports are the ultimate outcome of online surveys, and their insights are the crème de la crème of the entire project. Analysis and conclusions derived from reports can help enhance HR processes in an organization, improve customer service engagement with the service department, or expedite order fulfillment in an online store.
– Reports have many applications – emphasizes Laura Dołęgowska, Product Marketing Manager at Startquestion. – Using them is beneficial for various purposes. They can help summarize, process, and analyze research results when making decisions. They are also helpful in monitoring changes, especially during cyclical research. Most importantly, reports can aid in sharing research conclusions with colleagues, teams, or management boards.
The Benefits of Presenting Survey Results in Reports
- Quick access to data so we can monitor and analyze results on an ongoing basis;
- The data is presented in a clear and visually appealing manner using tables and charts, making it easier to comprehend;
- Possibility of filtering and segmentation;
- Possibility to set alerts and react on an ongoing basis, e.g., to negative feedback or each new filling;
- Possibility to set up periodic reports (you decide about the time and recipients – you set it once, and you don’t have to log in to the panel multiple times);
- It’s easy to personalize your report by matching the charts to your company’s color scheme, adding or removing questions, and including your company logo or comments.
To present research results, researchers can use three main ways. It’s important to understand these methods and their advantages and disadvantages.
Each method is suitable for different types of researchers and their daily work. In this regard, we will briefly describe each way and its relevance to specific kinds of researchers.
What Are the Types of Survey Reports?
Raw Data
Advantages*:
- Easier analysis of results;
- View of completed and unfinished surveys;
- Organized .xls file, ready to work with data.
* – We refine raw data for you. This is what they will look like soon.
Disadvantages:
- Unattractive graphic design;
- They require further research work;
- They won’t work for a presentation to the board.
Who is this solution for?
– Raw data works well when clients have their own data visualization programs, e.g., sales or marketing ones. They only need to upload the collected feedback to the ATS used in the organization – explains Paweł Kruszewski.
This format is ideal for researchers who like (or need) to work with data. It is eagerly used by researchers and analysts who need large amounts of data to prepare their reports. Agencies also use raw data to prepare feedback according to their patterns or patterns imposed by the client.
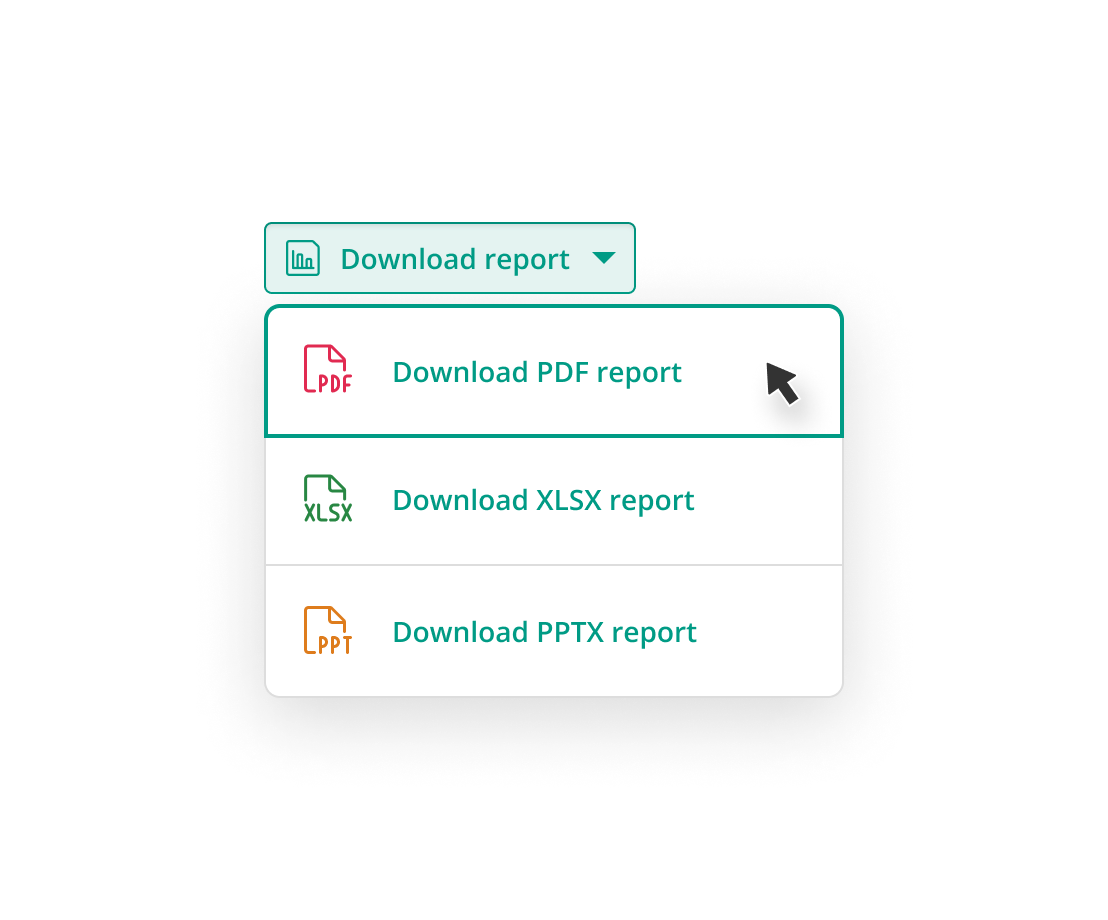
PDF Reports
Advantages:
- Aesthetics – modern, clear design;
- Ability to generate a report on unfinished surveys;
- Personalization – nice presentation of data for the board.
Disadvantages:
- Need to install a PDF reader;
- In the Startquestion platform – access to PDF reports from the business plan.
Who is this solution for?
– We observe that reports in PDF format are generated by employees of sales and marketing departments, and less frequently, but also by HR specialists who need to present data in charts that are readable to the team and their superiors – says Paweł Kruszewski.
PDF reports are used by clients with less research knowledge than raw data because it is not required. To present the collected data, generate a report in the system. Marketing, CX, and HR specialists use this format.
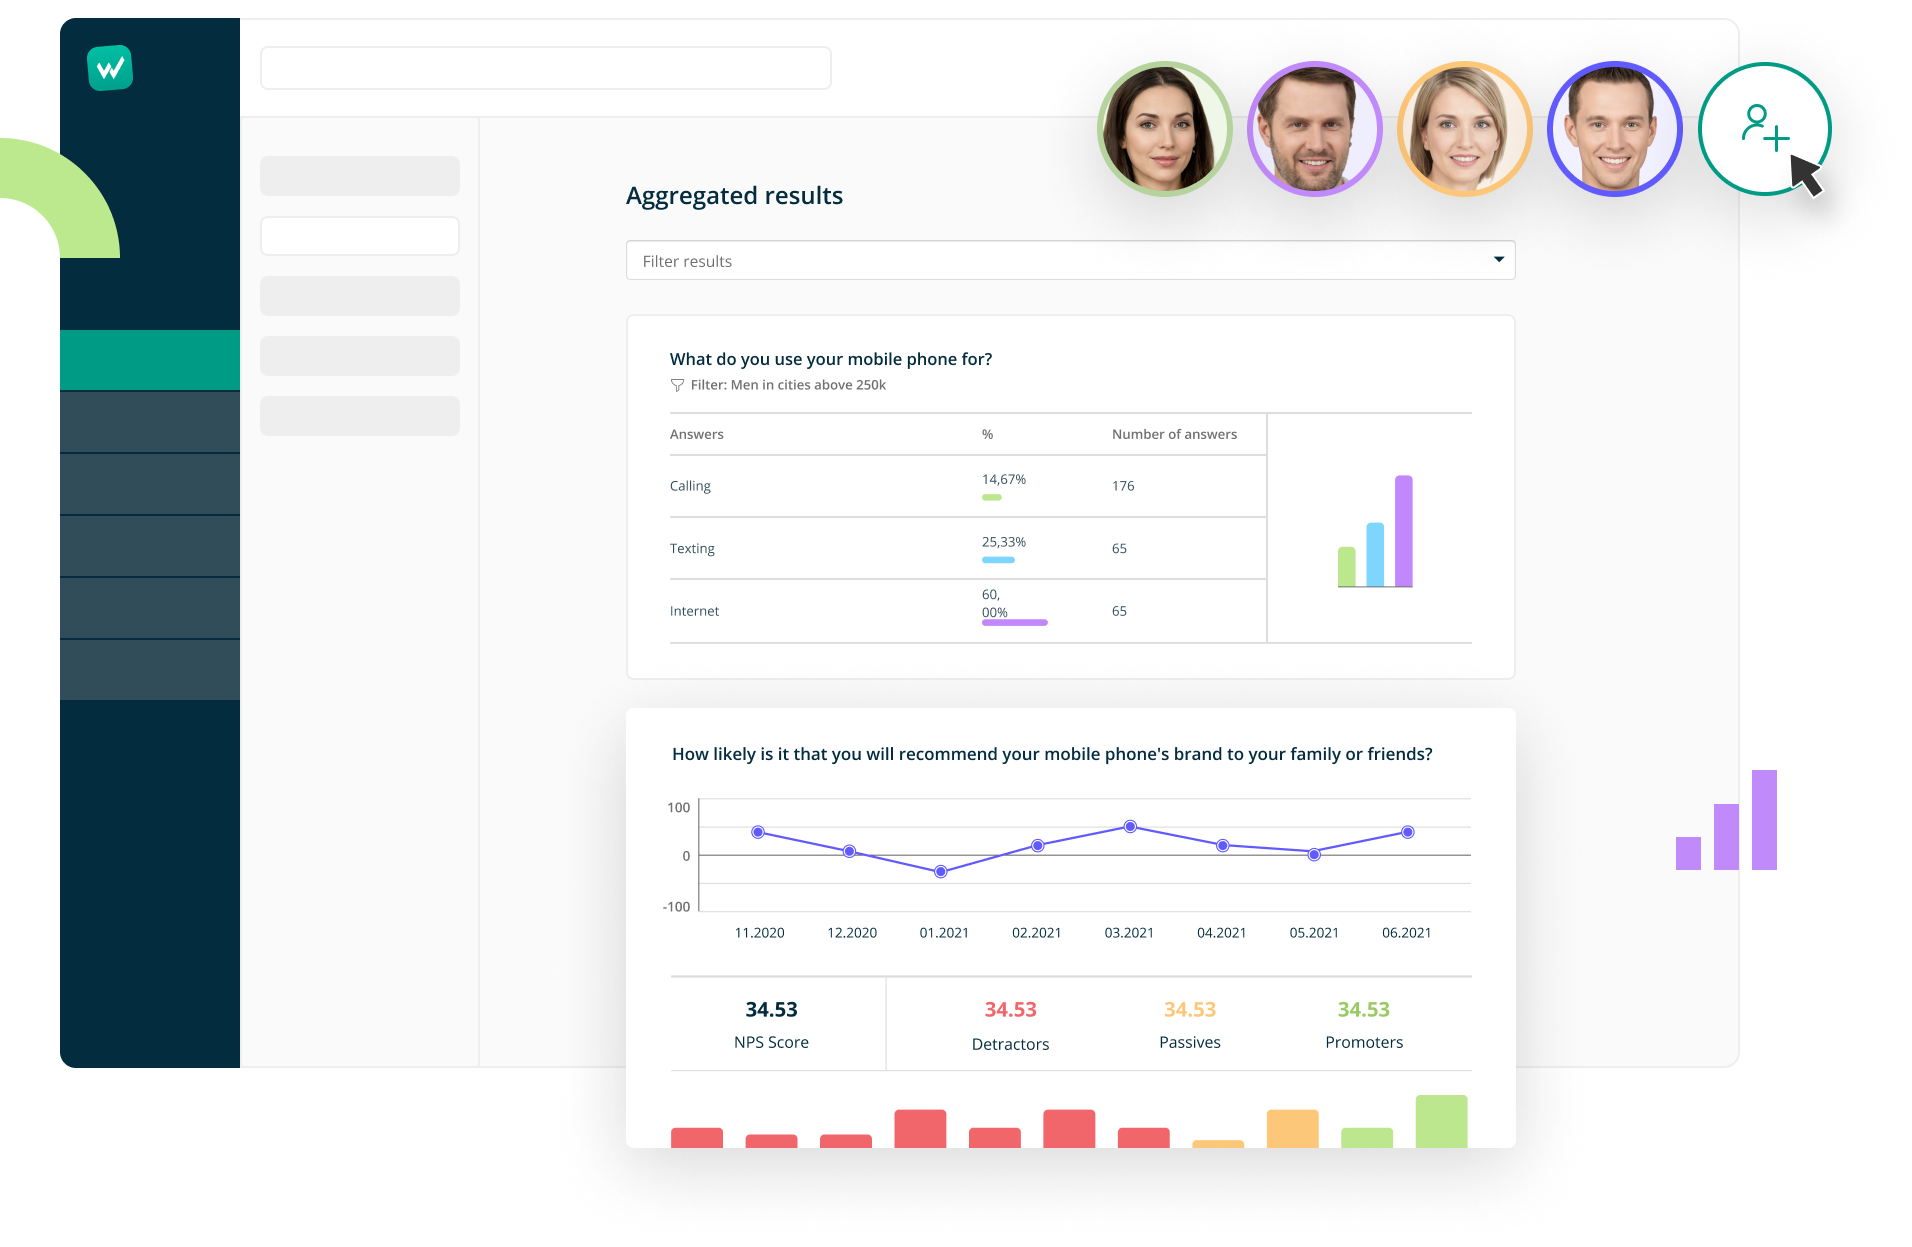
Live Reports
Advantages:
- Ease of sharing results;
- Real-time update;
- Private/public link setting;
- Effectively engages colleagues.
Disadvantages:
- Not for HR research (except internal communications).
Who is this solution for?
Researchers conducting ongoing research. A helpful format for CX professionals, with minor exceptions. However, it will not work where anonymization of survey results and respondent data is most important (e.g. HR surveys, outside internal communication).
– The online report can be analyzed by anyone who receives a link to it, there is no need to carry out status updates, we can easily involve a team in the research – explains Laura Dołęgowska. – Another advantage is the ease of sharing results, all you need is a link, and privacy settings will ensure that only authorized people have access to it.
– The advantage of an online report is also time-saving. Dashboards enable current presentation and observation of collected data – adds Paweł Kruszewski.
Happy Ending with Survey Report Presentation
Right before the ending, let’s return to cinematic rules.
The most popular rule for ending a good production is that the last scenes must solve the puzzles the characters face and stay with the viewer long after they leave the cinema or turn off Netflix.
As with survey reports, it is essential to present investigation results in a way that helps stakeholders understand the bigger picture of the problem being studied. By doing so, the information will be more memorable, and stakeholders will better understand how the investigation was conducted.
– The reports are there to make this task easier for us. They do not require analytical skills; they present data in a simple and eye-catching way, which we can immediately share with the team or superiors. However, for more demanding analysts, they constitute a sound basis for further research and conclusions – highlights Laura Dołęgowska.
Paweł Kruszewski points out other advantages of reports.
– Generating a report can save time and resources as it only requires a few clicks. It’s worth taking the time to check which format meets our expectations. The report also enables users to fully utilize our tool by undoing a good study’s third and final stage. A visually appealing presentation will make a better impression on many recipients than a plain table, so creating a graphically refined report is essential. Incorporating elements from successful business presentation examples can further enhance the impact of survey reports, ensuring that the data is not only comprehensible but also compelling, captivating stakeholders with a visually engaging narrative.
When it comes to presenting research results, it’s like last summer’s movie hits. Raw data and online reports are as different as Oppenheimer and Barbie, but each form has its fans and several advantages.
The biggest one? If you automate data processing and presentation in our software, you will free up time for another trip to the cinema. Have a good one!
Ready to upgrade your survey game?