
Professional analysis of survey results is crucial for solving specific problems and implementing positive changes based on feedback. Even if you have a high response rate and ask precise questions, it means little without proper analysis. At Startquestion, we aim to provide a tool that enables research creators to achieve their goals. We have introduced several changes to make analyzing survey results more accessible and faster. Let’s find out how we can help you conclude from your survey results.
Benefits of Analyzing Survey Results
Why is working with survey results the most essential part of good research? Because when used well, honest feedback can bring numerous benefits to the organization. For example:
More Happy Customers
Customer research (CX) is a tool for collecting opinions about client experiences. Surveys allow you to identify improvement areas and adjust to enhance consumer satisfaction.
Why is it so important? Consulting firm Bain & Company reports that an increase in customer retention of just 5% can increase profits by at least 25%.
Ready-to-use CX Survey Templates


Greater Employee Commitment
Employee research (HR) allows organizations to look at the company through employees’ eyes and learn about their concerns, motivation, and commitment.
The better a firm understands its staff and listens to employees’ voices, the more arguments it will have to increase morale, productivity, and retention in the team.
According to a Gallup study, engaged employees are more productive, customer-focused, and loyal to their employers.
Making Better Business Decisions
Research results help make informed decisions based on data, not assumptions.
According to a study published by Harvard Business Review, companies that utilize complex data to make strategic decisions are 5% more productive and 6% more profitable than their competitors.
Isn’t it worth being among them?
Ready-to-use HR Survey Templates


These are some examples of how research results can be applied. Depending on the surveys’ nature and the industry, these examples can vary depending on a particular organization’s needs and requirements.
Whether the queries are aimed at gathering information on product development or enhancing customer or employee satisfaction, it’s essential to remember best practices and techniques that will enable us to optimize the entire process.
Including proven survey tools.
New Survey Results in Startquestion
– No one conducts surveys without a previously established goal. It is about solving a specific problem in the company or implementing essential changes for the organization and its stakeholders. Wanting to support our users in carrying out these tasks, we decided to create a results module from scratch – says Magdalena Żądkowska, Product Manager of the Startquestion platform.
What does this mean in practice?
We have conducted a thorough analysis of the feedback provided by our customers. We paid close attention to the feedback from our support department and spoke to our product’s regular users. We identified the major pain points and areas that need improvement. Our goal was to make the tool more user-friendly and intuitive, such that even those who need to be better-versed in data analysis can efficiently work with the results without much effort.
– We are changing so that our clients can draw the best conclusions from their research and make the best business decisions. Therefore, we focus on intuitiveness and simplicity. New trends and crosstabs are good examples. They are very effective tools, but they often discourage users. In the latest version, they are easy to use and precise at first glance – adds Magdalena Żądkowska.
How We Can Help You with Survey Results
Here’s how we can help you work with feedback from respondents after making changes to the results module:
- All features in one place
You don’t have to switch between tabs (results, report creator, or crosstabs). Now, all functions are available in one place.
- Dynamic filters
New filters allow you to analyze survey results twice as fast as before. We have halved the number of clicks and steps needed to create filters.
- Increased efficiency
We have also introduced changes in technology. We have significantly accelerated the pace of displaying results by using solutions dedicated to processing large data sets. Thanks to this, even surveys with many completions are loaded in the blink of an eye.
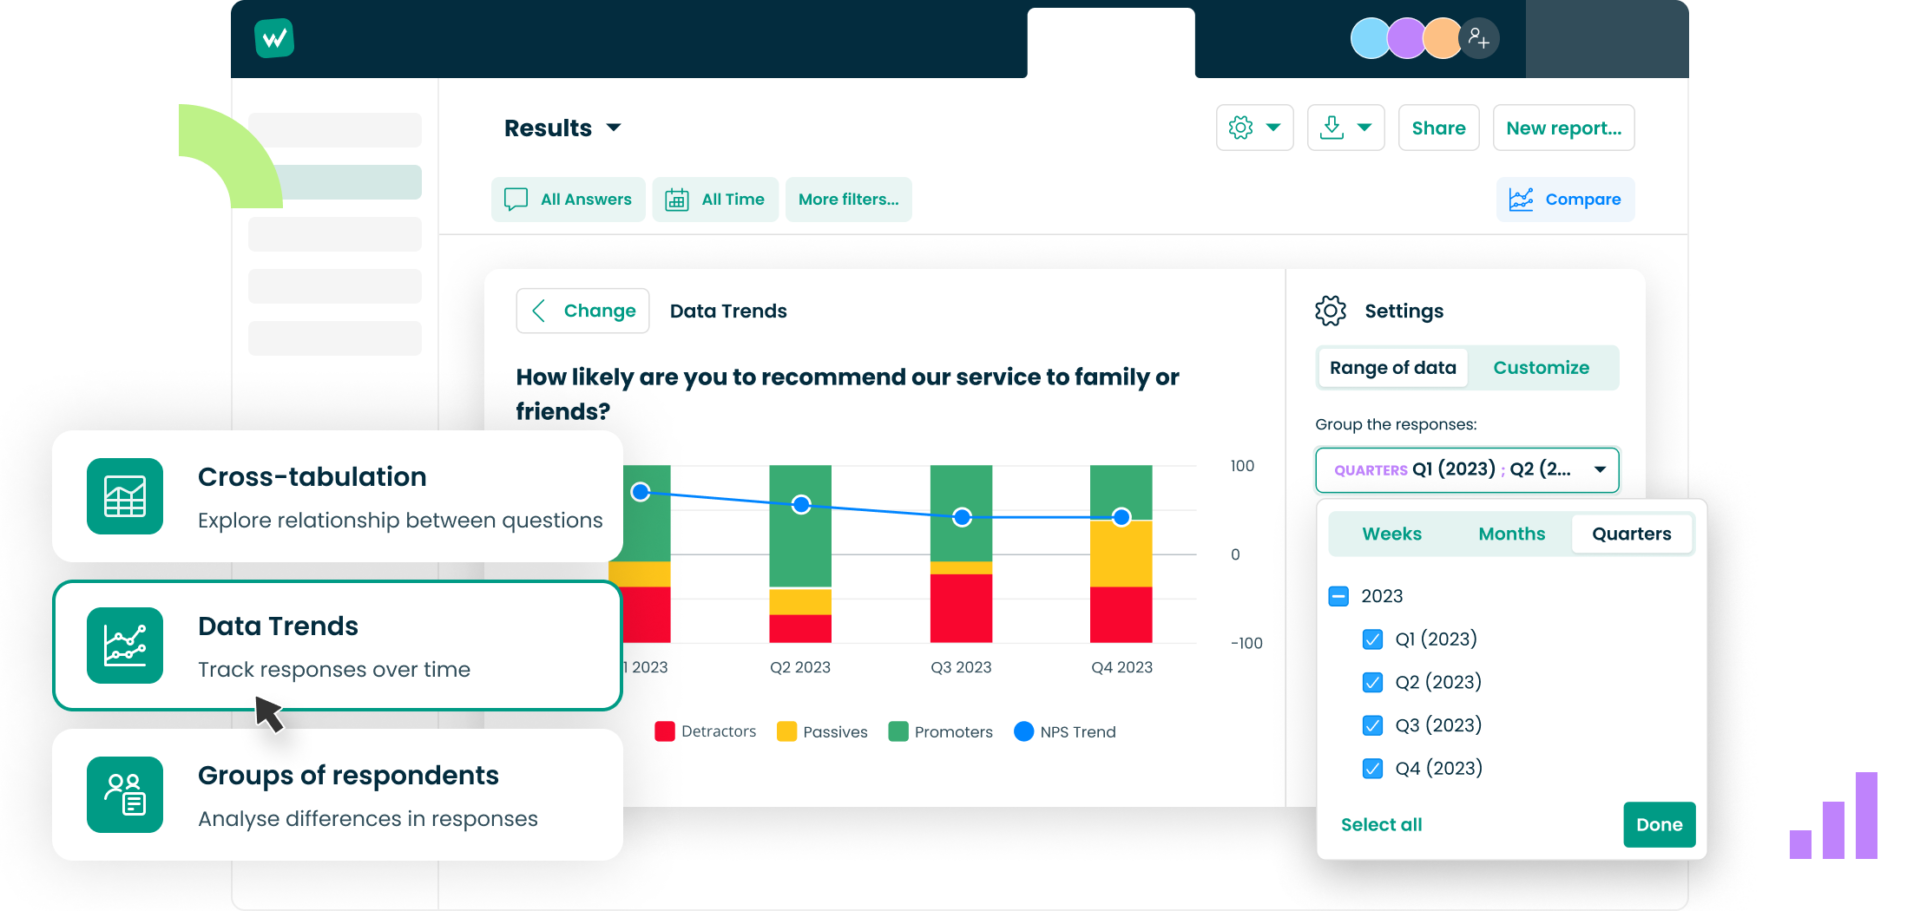
- Intuitive crosstabs and trends
Even if you have no experience in data analysis, you can easily compare answers to different questions or create a trend of answers over time. Click the plus icon between the questions, select which questions you want to reach, and… done!
- Create your own data views
Filter results, add your own content, change colors and chart types.
You can make use of the feature to save reports with different data. For instance, you can create a report to gather critics’ votes, another report to collect data from the last 30 days, and a third report to collect feedback from the entire year. It’s easy to switch between these reports and share the link with your colleagues or team, such as the person in charge of monitoring the NPS indicator.
- Design tailored to your company
We know how much branding means. From now on, you can create your corporate color palette and apply it to every report and survey with one click.
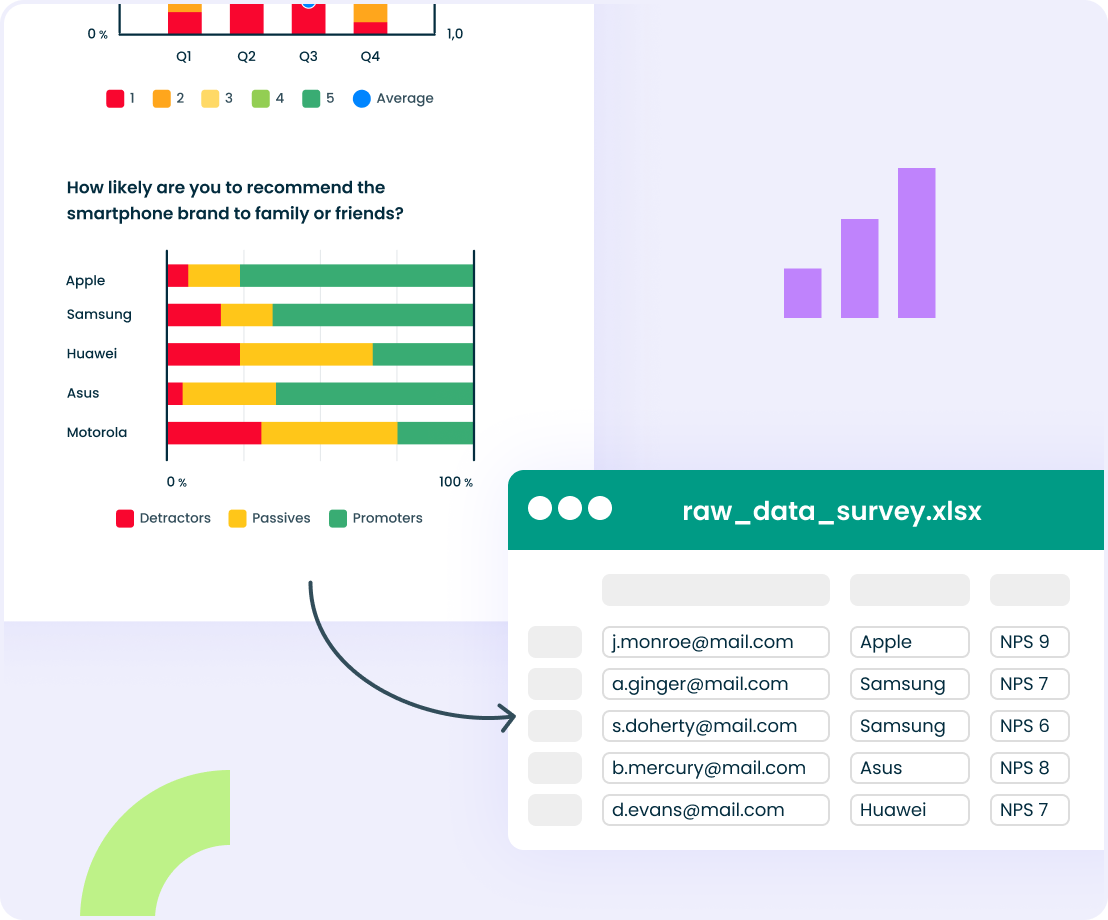
- Save the chart as an image
You don’t have to download the entire report or take a screenshot to download a specific chart. After adapting it to your needs, save the changes and download it to your disk in image format.
- Quick link to the report
Results are ready? If so, you can easily share them with your stakeholders in just one click. You can share the research report using a private link that is only readable by people included in your package/plan. It ensures the confidentiality of the information that is transmitted.
It is an excellent moment to thank our users for these changes.
Magdalena Żądkowska:
– We tested each new function with you. We talked to learn about your problems and expectations, and then, after designing and implementing the changes, we tested new solutions together. Throughout the entire process, we listened to your suggestions and made changes to the project on an ongoing basis. Thank you!
5 Good Practices in Working with Survey Results
We now know why a good survey continues beyond preparing questions and sending the questionnaire to respondents. Now, let’s consider how to obtain and use valuable feedback expertly.
1. Ensure the quality of data to be processed
No tools will help if we try to conclude incomplete, biased, or misleading data. Will the analysis of employee feedback make sense if we only consider praise directed at the management board? NO. The analysis makes sense when the information is reliable, respondents answer clearly and objectively constructed questions, and the survey questionnaire is tested before being sent.
2. Choose the right analytical tools
Can you manually collect feedback and analyze research results? Yes, as long as we deal with a relatively small group of responses.
This way of working will work well in HR research in a small company, but can you imagine similar activities in e-commerce, where hundreds of transactions occur daily? It is worth testing and selecting optimal data processing tools to quickly discover essential trends and correlations.
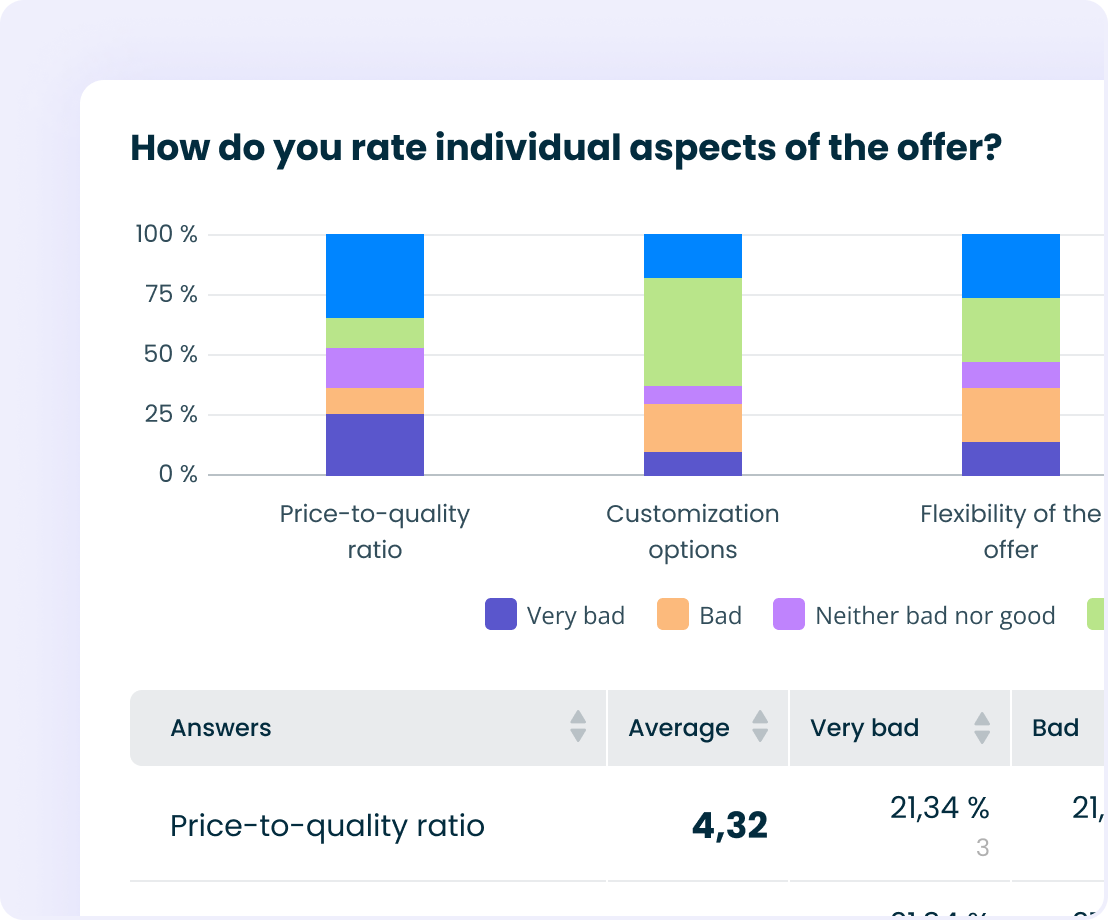
3. Present the results in a clear form
The primary goal of a good survey is to make decisions based on the conclusions drawn from the analysis of the obtained feedback. Present the results in a clear and accessible way so that they are readable and understandable to each stakeholder group. Thanks to this, they can efficiently make the best business decisions.
4. Use feedback to act
It is the most critical point of working with the results and conducting the research. Use the conclusions from the collected feedback to eliminate problems reported by customers/employees or to develop your offer.
5. Check whether the actions taken were successful
Working with survey results continues after implementing changes. Let’s imagine that the problem addressed in the study concerned customers’ opinions about the work of Customer Service.
Monitoring feedback on support work is necessary to ensure corrective actions effectively increase customer satisfaction with support interactions.
Do you want to save time and nerves working with survey results?