If you finished collecting the survey results, the next step will be to learn from these results. This step is referred to as survey analysis. This step decides how the collected results will be interpreted, e.g. whether the assumed research hypotheses will be proven or refuted. Survey analysis is usually a tedious and lengthy process, especially if you are dealing with a long questionnaire filled out by a large number of respondents.
Startquestion comes in handy here. By creating a questionnaire using our survey software, you can perform data analysis… with a few mouse clicks. What’s more – the tool allows you to automatically generate reports. Below, we will explain how to start the analysis and take full advantage of the tool’s capabilities, thus reducing valuable time and effort.
Startquestion is a survey software
Gather feedback via weblink, social media, email, and more.
No credit card required · Cancel any time · GDRP Compilant
Survey analysis based on the particulars section
In your research, you probably asked the respondents a few questions that make up the so-called particulars section. This is the part of the survey in which basic data about the respondent is collected, e.g. age, gender, education, etc. (read more about the particulars section). It is worth starting the survey analysis by filtering the collected results in terms of how a specific group responded. You can create a filter on the basis of each question asked in the survey, e.g. about gender. This is how you can obtain collective information on how all the questions were answered by women. Here is an example of applying the particulars question filter:
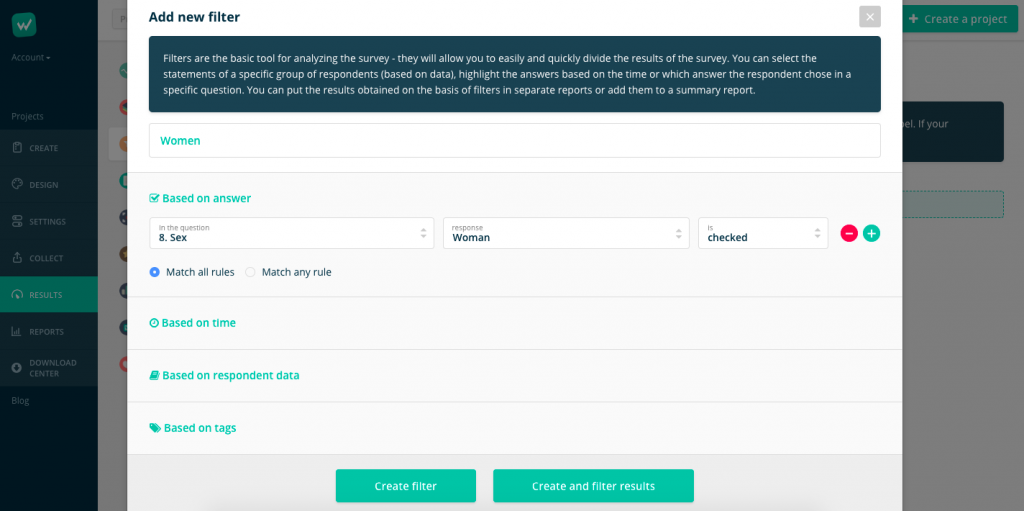
Such information filtering will allow you to obtain information and automatically create reports for a specific group. Thanks to this, you can easily compare how individual questions were answered by, for example, by people under 20 vs. people over 20 years old, and insert such statements into the report.
Survey analysis using a cross table
Crosstables were created in order to ensure an even more advanced comparison of the collected data, and thus draw new, useful conclusions. When you create cross tables, they compare the responses from two different questions or data segments (labels for a respondent), which makes it easy to see how the respondent answered not only one question but also others. Data analysis on the basis of cross tables can lead to a number of interesting conclusions, such as, for example, the analysis of the relationship between how specific groups answered specific questions (e.g. only women) or the distinction of characteristics of the responses of specific groups.
Keep in mind that a cross table is an effective method of data analysis only with an appropriate combination of questions and data segments. For example, you can ask a question about gender, with a substantive question about the research topic, as in the example below:

After creating a cross table, the user gains access to filtered information – a table and a graph appear, which can be implemented in the report or downloaded as raw data.
Advanced analysis thanks to access to raw data in Excel sheets
Sometimes the information in automatically generated reports is not enough. Some studies require compiling a large amount of data from already filtered information, creating more complex graphs or histograms. In such cases, it is a good idea to use the option of exporting the collected data to an Excel sheet:

You can export summary results and raw data to an xlsx format. When downloading raw data, each line has a separate fill. Thanks to this, you can filter the results or find the responses of a specific person. It contains information ready for in-depth analysis and synthesis later. There are synthesized data available already in the collective results – if you do not need a more in-depth analysis, and you only want to know, for example, the percentage distribution of responses to a given question, this option will be the most suitable for you.
You can download raw data and collective results for the entire survey, as well as for the created filter and cross-table. Ensure data security through tokenization to safeguard sensitive information during the download and analysis process.
How to prepare a survey report?
Once you have properly analyzed the data, it is worth focusing on an attractive, legible survey report. Startquestion will help you create such a report thanks to its convenient report wizard. You can export the created report as a PDF file or a link placed on our server.
Use ready-made survey templates for your research
Use Startquestion and analyse results the way you want!
Only some of the tool’s capabilities have been presented above. In fact, how you analyse the collected data depends on your needs and imagination. Thanks to the features offered by Startquestion, you can sort, filter, extract, and therefore analyze data with just a few clicks. You can test all of them for free today – create an account on startquestion.com and try the possibilities of our platform for 14 days.
When looking for ways to analyze data tailored to the requirements of a specific study, we encourage you to use our tutorial and contact our support team.